debasement hedge
website and ui still in design
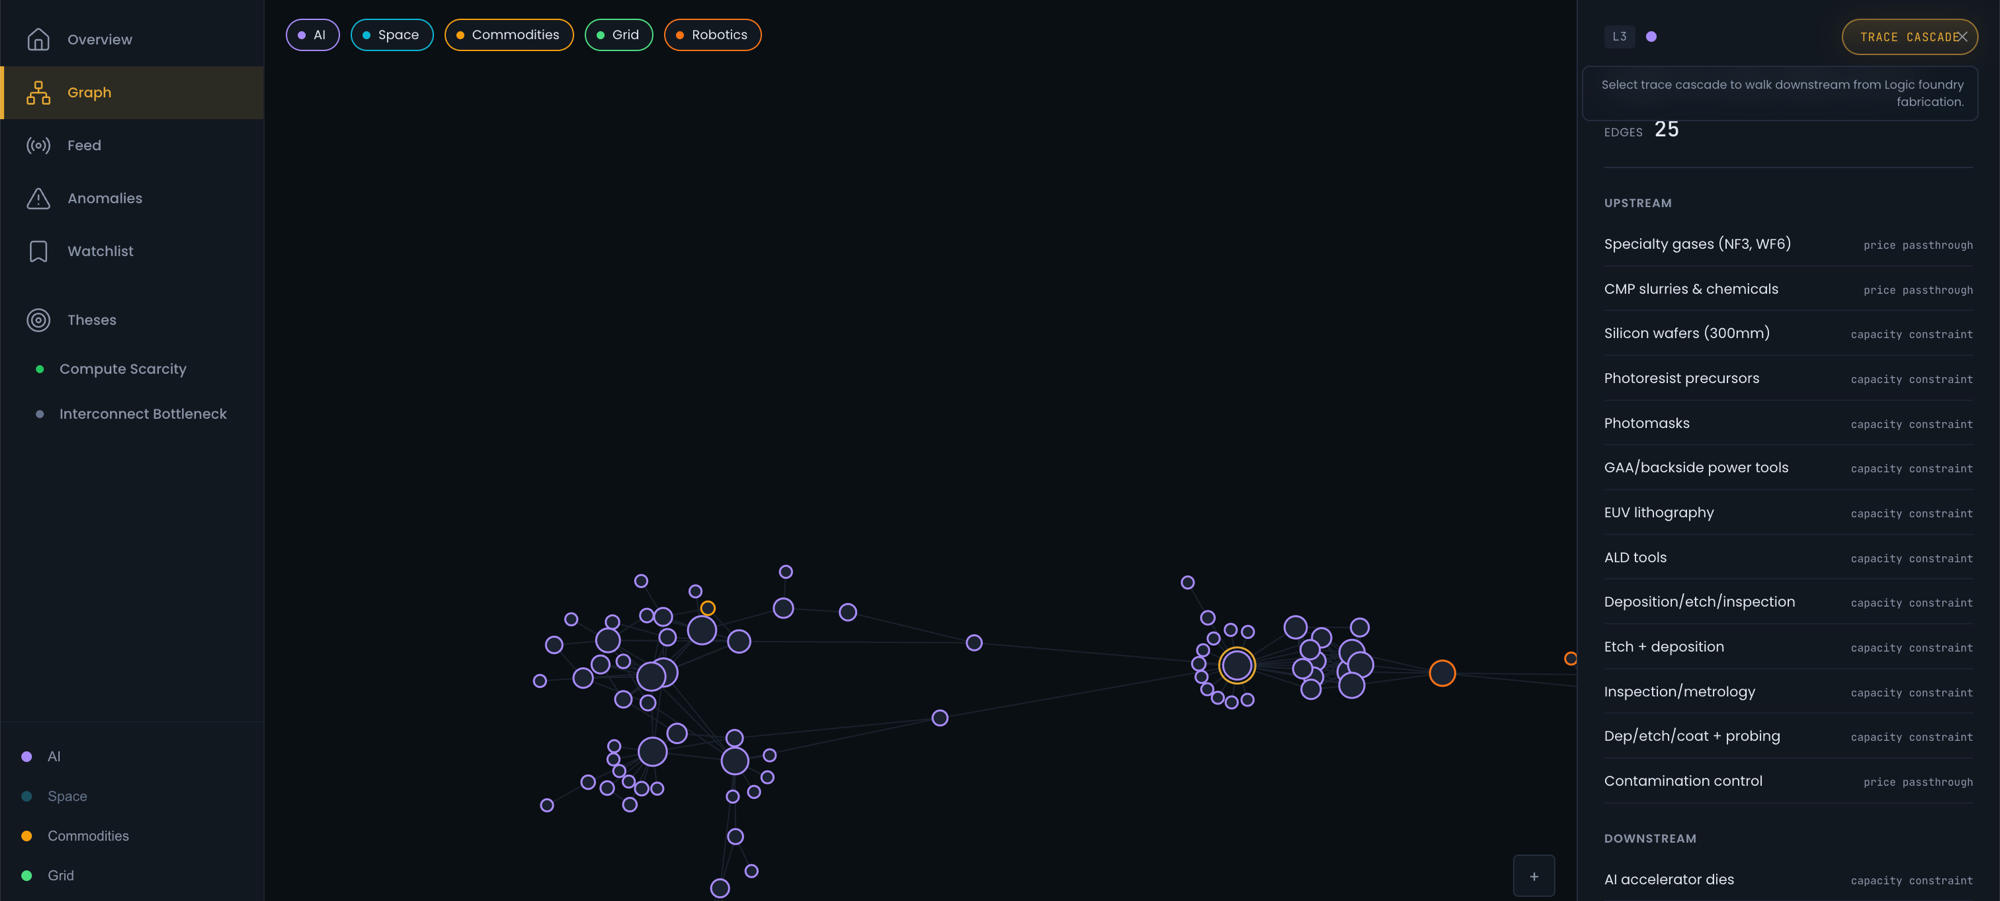
i check this multiple times a day — what's heating up in my themes, what's anomalous on the watchlist, what's changed since yesterday. on-demand monitoring, not a morning briefing.
the problem
debasement hedge is a monitoring framework with one job: catch supply-chain dislocations before the financial markets price them in, while there's still an edge to act on. the signals that move asset prices — a capex commitment, a capacity constraint, a lead-time blowing out — show up in the physical economy months before they reach an earnings call or a share price. the problem is reach: those signals are spread across a hundred-plus regulatory feeds, exchange filings and trade-press sources in a dozen languages, and they lose value by the day. no person can watch that surface fast enough. by the time a dislocation is obvious, the edge is already gone.
the approach
- 01 principle
the financial layer is downstream of the physical layer.
- capex is signed months before earnings calls confirm it; capacity tightens quarters before it reaches margins.
- so the framework watches the physical economy directly — what's being built, ordered and shipped — and works forward from there.
- 02 ingest
a hundred-plus sources are polled continuously and reduced to one common format.
- sources span regulatory filings (sec edgar, fred, eia), asian exchange disclosures, industry data and trade press.
- claude sonnet reads each item and reduces it to structured signals — each tagged with one of eight types: price, capacity, lead-time, order, capex, milestone, policy or disruption.
- non-english sources are verified by blind back-translation before they're trusted.
- 03 map
signals are placed onto a supply-chain knowledge graph — a hand-built map of the real economy's dependencies.
- more than a hundred supply-chain positions — a material, a component, a process, an assembly, a system — wired together by over 150 dependency edges.
- each edge is typed by how a disruption transmits — price pass-through, capacity constraint, volume allocation or timing delay — and by market structure, from monopoly to competitive.
- concretely: ajinomoto's abf film (a material) feeds abf substrates (a component), typed a capacity constraint from a near-monopoly supplier — so a shortage there is a hard bottleneck, not a cost a buyer can pay around.
- 04 propagate
a signal on one position is implicitly a signal on everything downstream of it.
- the framework walks the graph outward from the affected node, up to three hops.
- follow that same edge: a disruption on abf film propagates to abf substrates, then to the chip packaging built on them, then to the ai accelerators that can't ship without it.
- confidence is stepped down at every hop — a direct observation is a fact, a three-hop derivation is a lead. impact travels; certainty doesn't.
- 05 flag
an anomaly engine tests every signal against a library of named patterns.
- patterns include a price breakout, a lead-time extension, a capacity threshold crossed, or one company stressed across many positions at once.
- crucially it weighs each signal by surprise, not size — the same signal counts for more when it contradicts what the framework already believes than when it confirms it.
- 06 gate
every claim the framework tracks — a thesis — sits in one of six states.
- a thesis is a claim about one part of the supply chain, such as "abf substrate supply is tightening".
- its state is one of forming, active, confirmed, threatened, invalidated or expired.
- signals and anomalies move a thesis between states, and every transition is logged with what triggered it.
- the dashboard always shows which theses are still load-bearing and which have been invalidated.
- 07 discipline
the framework surfaces the edge; it doesn't trade — observation precedes action, and what to do with a flagged dislocation is the user's decision.
engineering challenges
- heterogeneous ingestion
the framework only works if every source ends up comparable — one anomaly engine has to run across all of them, whatever the origin.
- the inputs have nothing structurally in common: an sec filing is structured xml, an asian exchange disclosure is a pdf, fred is a numeric series, trade press is prose, a news alert is a bare headline.
- they span a hundred-plus sources and a dozen languages, and share only one thing — any of them might carry a price, capacity, capex or lead-time signal worth catching.
- ingest each in its native shape and you don't have a system; you have a hundred parsers that can never be reasoned about together.
nothing is ever stored in its own shape — every source is reduced to one structured object at the door.
- claude sonnet reads each raw item and extracts signals, each tagged with one of eight fixed types — price, capacity, lead-time, order, capex, milestone, policy, disruption.
- the model is asked what was observed, not what it means: a classification is auditable, a prediction isn't.
- once every source speaks that one vocabulary, a single graph and a single anomaly engine run across all of them.
- multilingual integrity
the earliest physical-layer signals often surface in non-english sources — japanese, korean and taiwanese filings — because that's where the supply chain physically sits.
- a samsung or sk hynix disclosure can lead an english-language earnings call by months.
- but translation is a silent failure mode: a mistranslation throws no error, it just produces fluent, confident, wrong text.
- and because every input becomes a signal on the graph, one bad translation attaches to the wrong position and propagates downstream — false signal with nothing to catch it.
translation is treated as an untrusted boundary, not a utility call.
- every non-english source is verified by blind back-translation — a second pass translates the result back with no sight of the original.
- the two are compared: agreement is evidence the meaning survived; divergence flags the input before it ever reaches the graph.
- a silent failure is converted into a loud one — an unverifiable translation is rejected at the door, not discovered later as noise three hops deep.
- propagation without false confidence
the graph earns its value by propagation — but propagation has a dangerous default.
- the point of the graph is that a signal on one supply-chain position is implicitly a signal on everything downstream of it.
- but if a signal crosses a dependency edge unchanged, its certainty crosses unchanged too.
- a weak, unconfirmed signal walked three or four hops out would arrive looking identical to a directly-confirmed fact — the graph would manufacture false confidence as a side effect of doing its job.
impact and certainty are propagated separately.
- a breadth-first walk carries the signal downstream, but confidence is stepped down at every hop — a derived signal is explicitly weaker than a direct observation.
- propagation is capped at three hops and cut off below a minimum confidence, so a signal can't travel indefinitely and accumulate false weight.
- where two paths reach the same position, only the shortest is kept — the strongest version of the signal, not a pile of weak echoes.
- the graph still surfaces second-order connections, but a far-away signal can never impersonate a confirmed event.
- surprise, not deviation
an anomaly engine that flags every large move is useless — most large moves are already expected.
- supply chains move constantly: seasonal demand, ordinary capex cycles, prices that drift. flag all of it and the real dislocations drown in noise.
- and "large" is the wrong test anyway — a price move the framework already predicted is not news; a small move that contradicts a confirmed thesis is.
- the hard problem is measuring a signal against what the framework already believes, not against zero.
every signal is weighed by the thesis it lands on, not just its own size.
- the framework holds a thesis on each part of the supply chain, each in a state — forming, active, confirmed, threatened, invalidated, expired.
- a signal that confirms an already-confirmed thesis is downweighted as expected; a signal that threatens one is upweighted as a contrarian alarm.
- a separate rule catches concentration — one company showing stress across several positions at once — which no single-signal threshold would ever see.
- the engine flags surprise relative to the current belief, which is what a dislocation actually is.