AI Bottleneck Monitoring
A supply-chain intelligence platform I designed, built and now run end to end using AI-assisted engineering. The aim is to identify investable developments before they become obvious in earnings commentary or mainstream financial research. Evidence, not trade instructions — the user decides.
The three questions
How it’s built
- 01
Collect
Thirty-eight automated pollers monitor filings, transcripts and trade press in English, Korean, Japanese and Traditional Chinese.
- 02
Filter and route
Language-specific dictionaries map native-script company names to verified entities, tickers and graph nodes.
- 03
Validate and extract
Structured data, not summaries; the output is schema-validated before it reaches the database.
- 04
Propagate
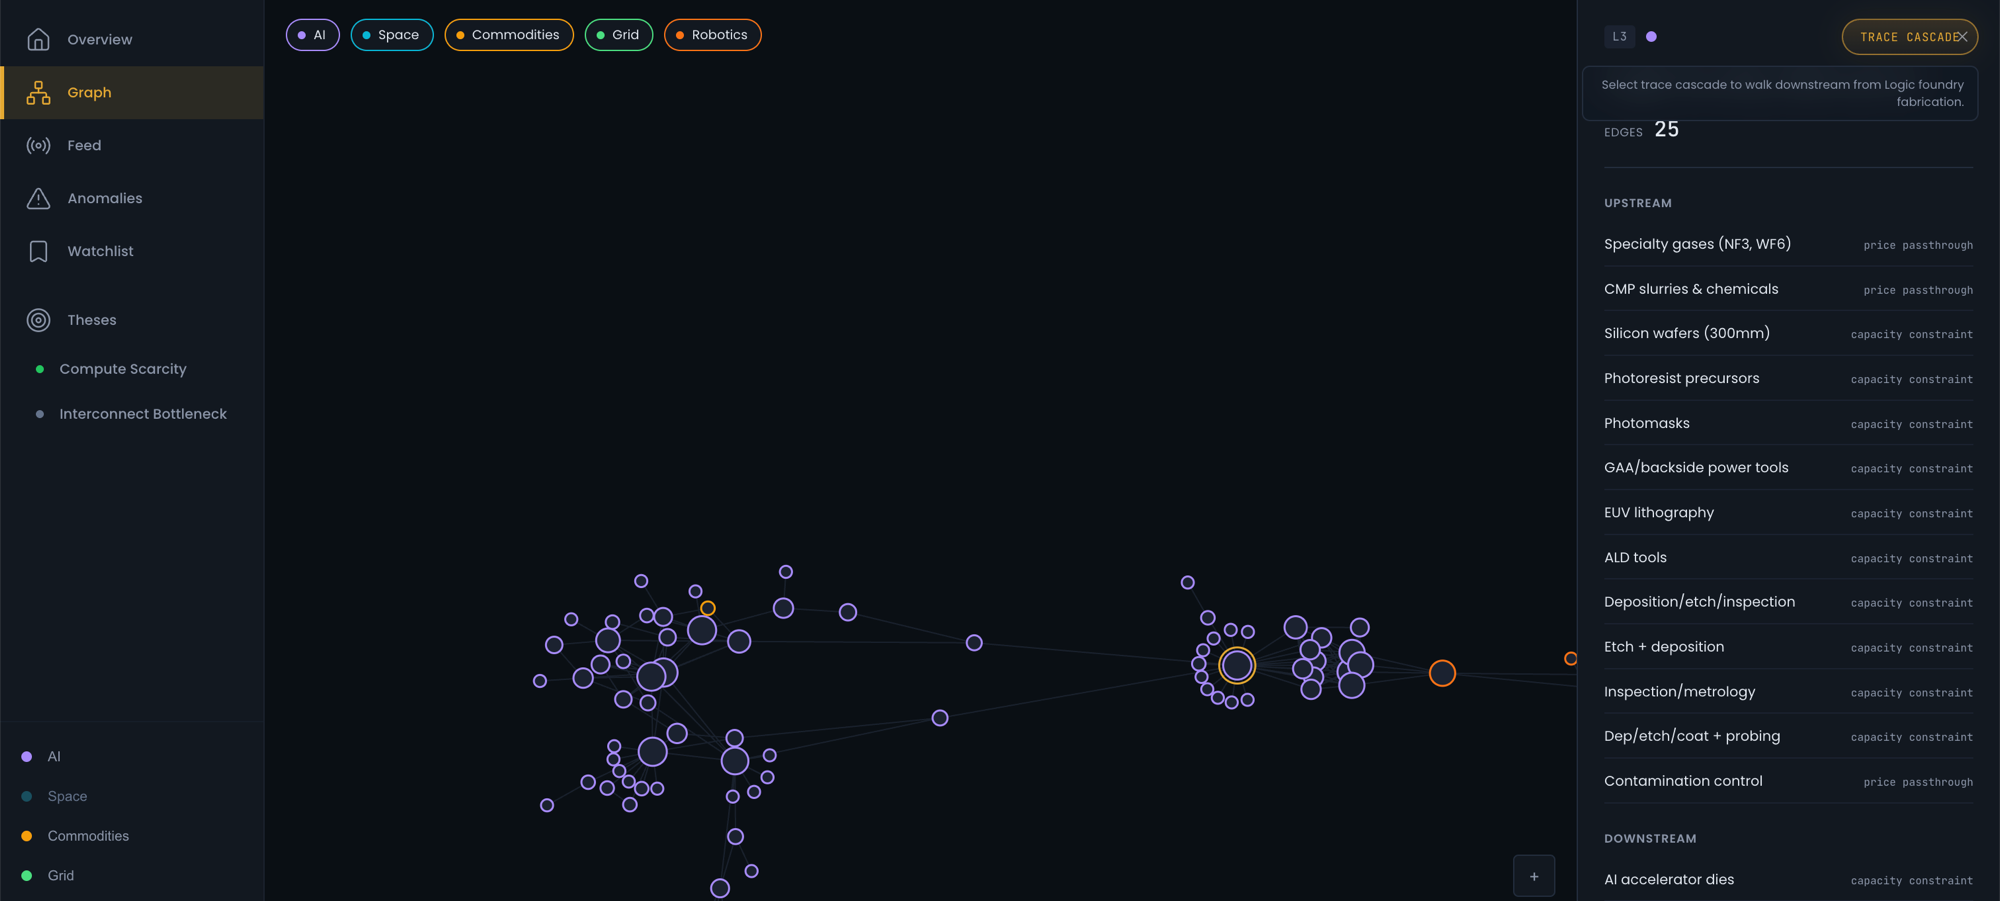
Confidence decays with distance, so a direct supplier relationship receives more weight than a third-order inference.
You cannot set a useful tripwire on “semiconductors are tight.”
You can on: ABF substrate lead times increasing by 20%, memory prices moving beyond their recent range, a critical supplier announcing unexpected capacity expansion.
One job, in the user’s words
“When I review the market each week, turn scattered evidence into a short list of stocks I can assess, so I do not have to repeat all the research.” The user’s role should be to agree or disagree.
The physical evidence underneath
Decision · No invented tickers
- Decision
- Before an article can generate a signal, it must pass a mandatory entity-registry gate: the companies, tickers and graph nodes referenced must already exist in the curated registry.
- Rejected
- Trusting extraction output. The one bypass is deliberate: direct graph-node matches, so a relevant technical article is not discarded for not naming a listed company.
- Result
- Unknown entities, invalid signal types, missing evidence and malformed rows are rejected rather than silently accepted.
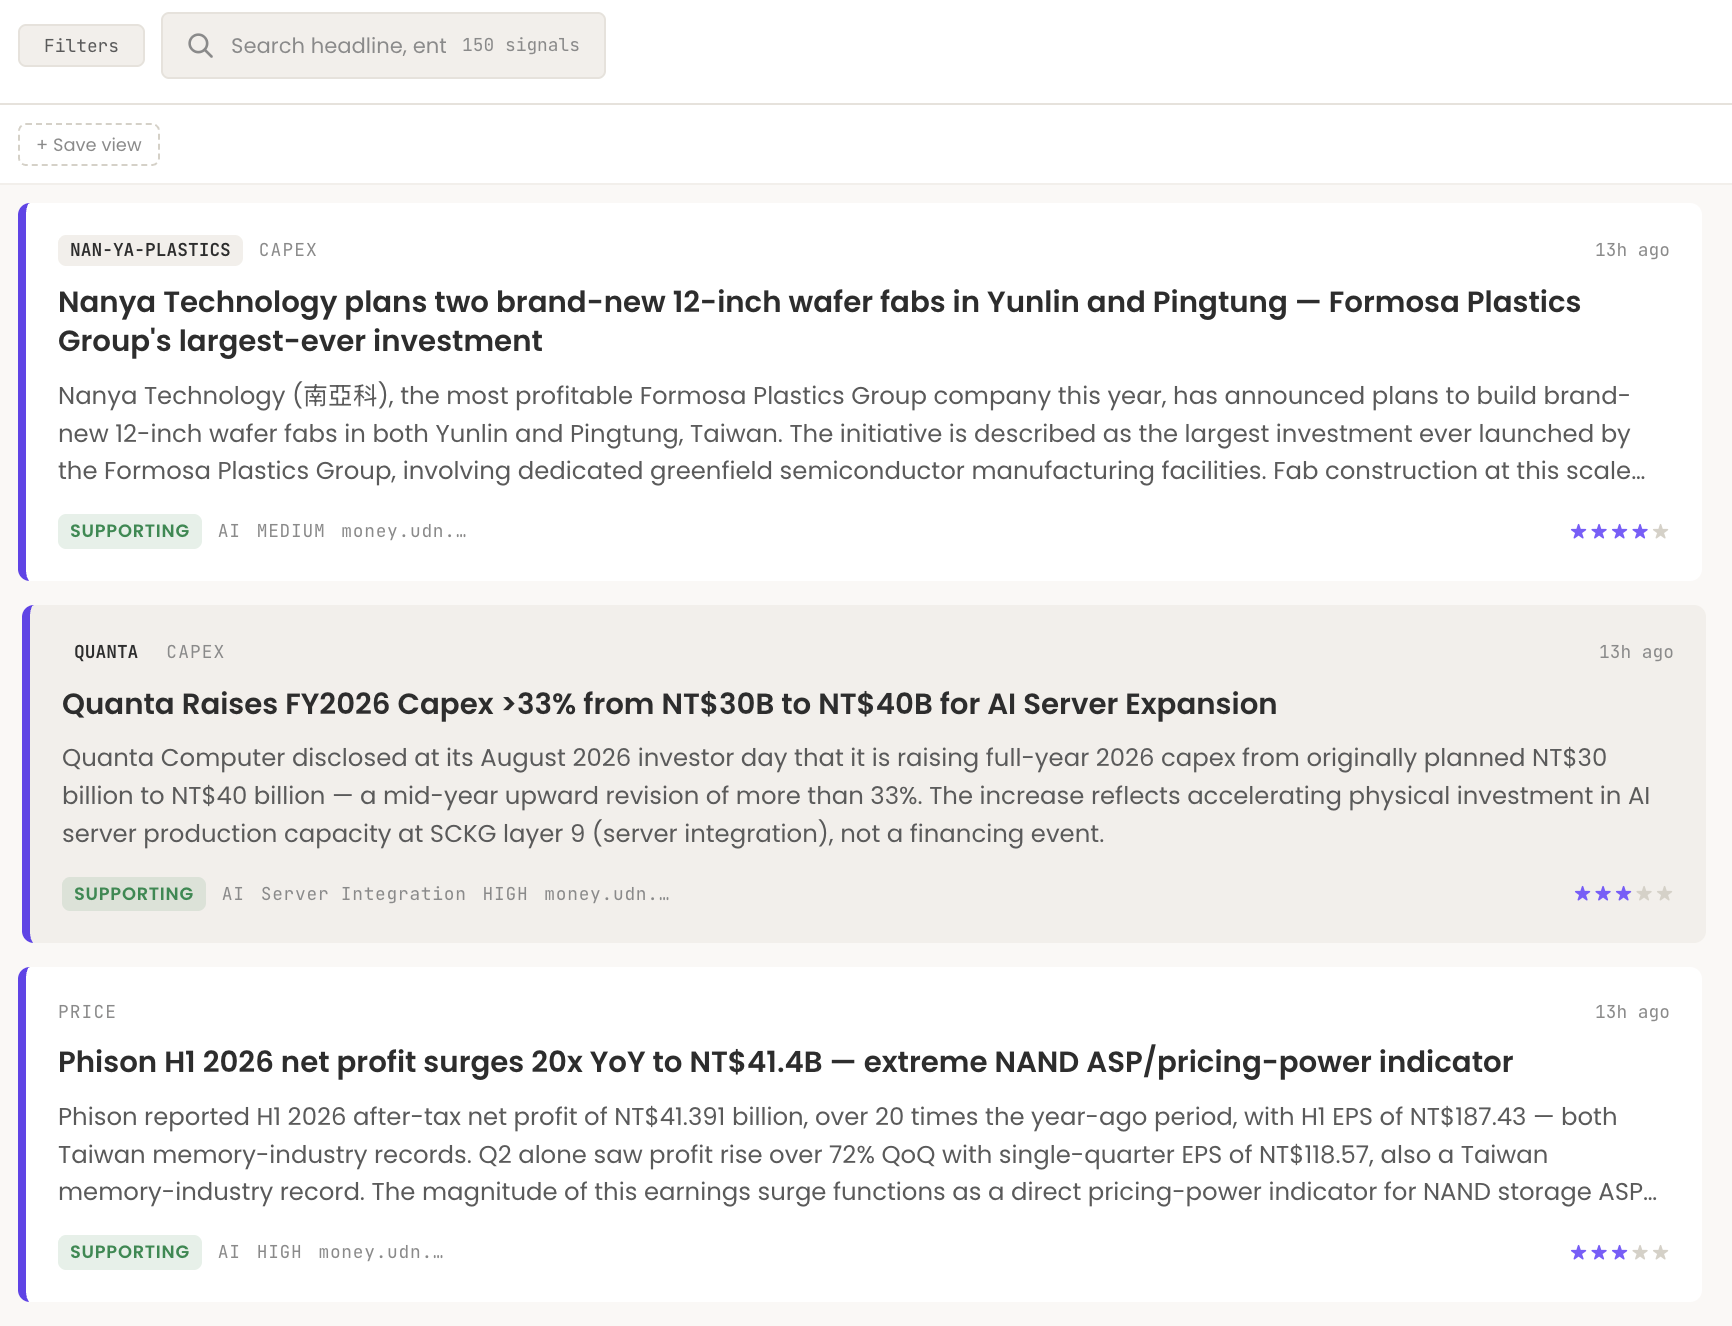
Instead of trying to interpret broad narratives such as “AI infrastructure demand is strong,” it monitors the physical evidence underneath them: orders, capacity, prices, lead times, utilisation, inventories and capital expenditure.
- That research became a supply-chain knowledge graph containing 145 nodes, 251 typed relationships and 261 verified entities. Every relationship is backed either by a quotation from the original research or by a clearly declared gap that I filled through additional domain research.
- The product does not simply summarise an article. It can attach a development to a specific supply-chain node and reason about which suppliers, customers and downstream markets might be affected.
“Management is optimistic about AI” is not a signal. “The company increased advanced-packaging capacity by 20%” is.
/ask, the research agent
Decision · Bounded authority
- Decision
- The agent never writes to the graph itself; any node it proposes requires human approval before it lands.
- Rejected
- Letting the agent grow its own ground truth.
- Result
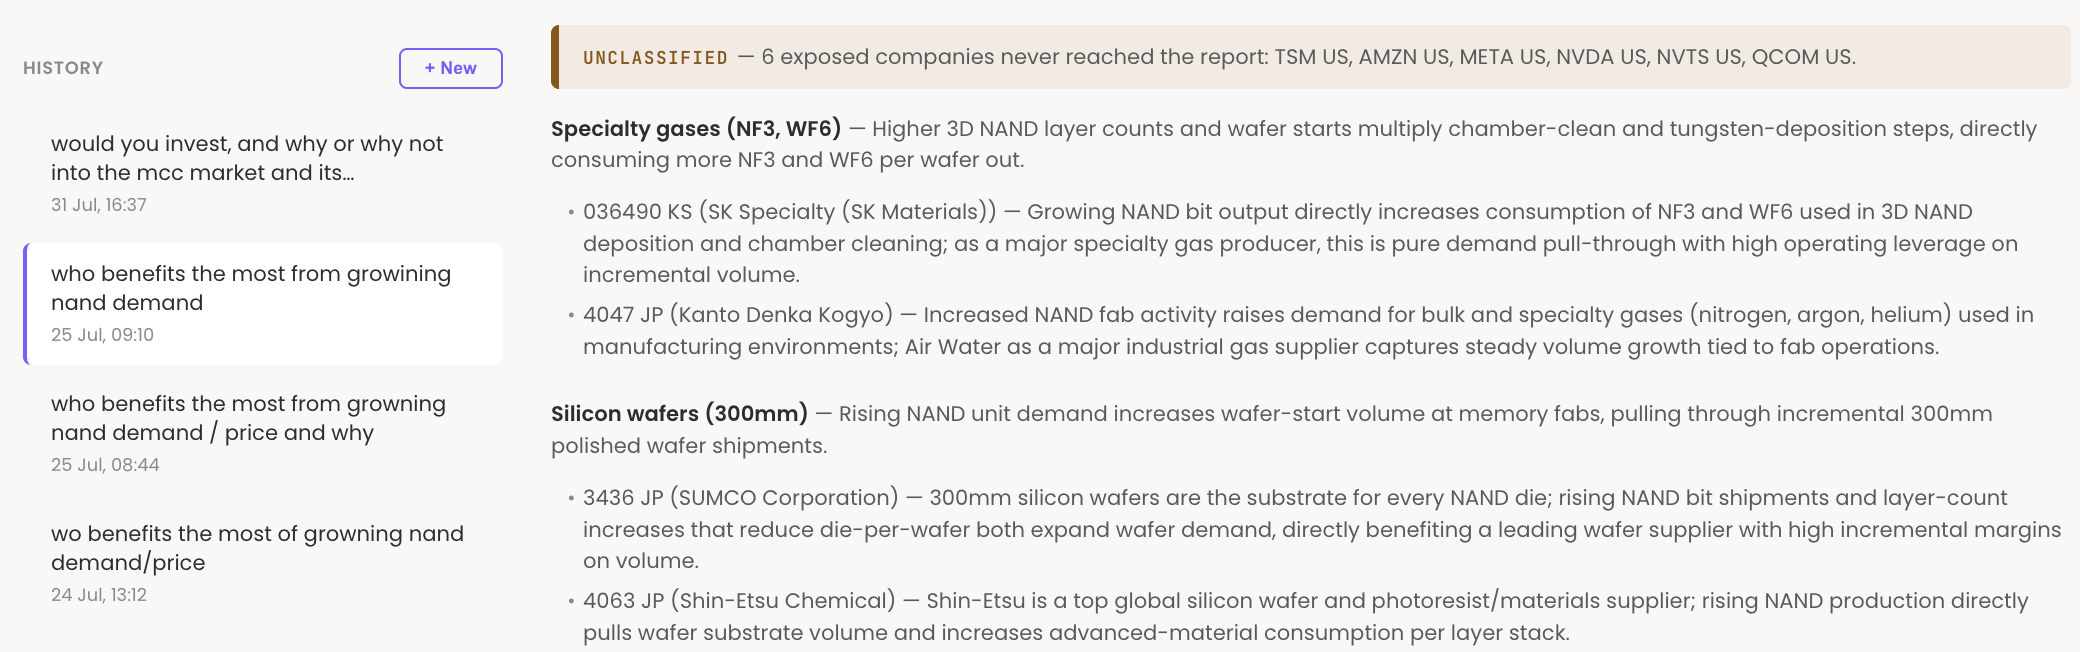
- Two live jobs returned only 19/42 and 44/191 entities, so a final reconciliation now computes exactly which exposed tickers the model silently omitted and re-prompts with an explicit must-classify list.
A user poses a free-text supply-chain question (“biggest winners in Vera Rubin chip production”), and the system runs a multi-stage pipeline that plans sub-questions, fans out worker calls to ground them in evidence, and synthesizes a ranked report of tickers classified as tracked, candidate, or unclassified, with citations.
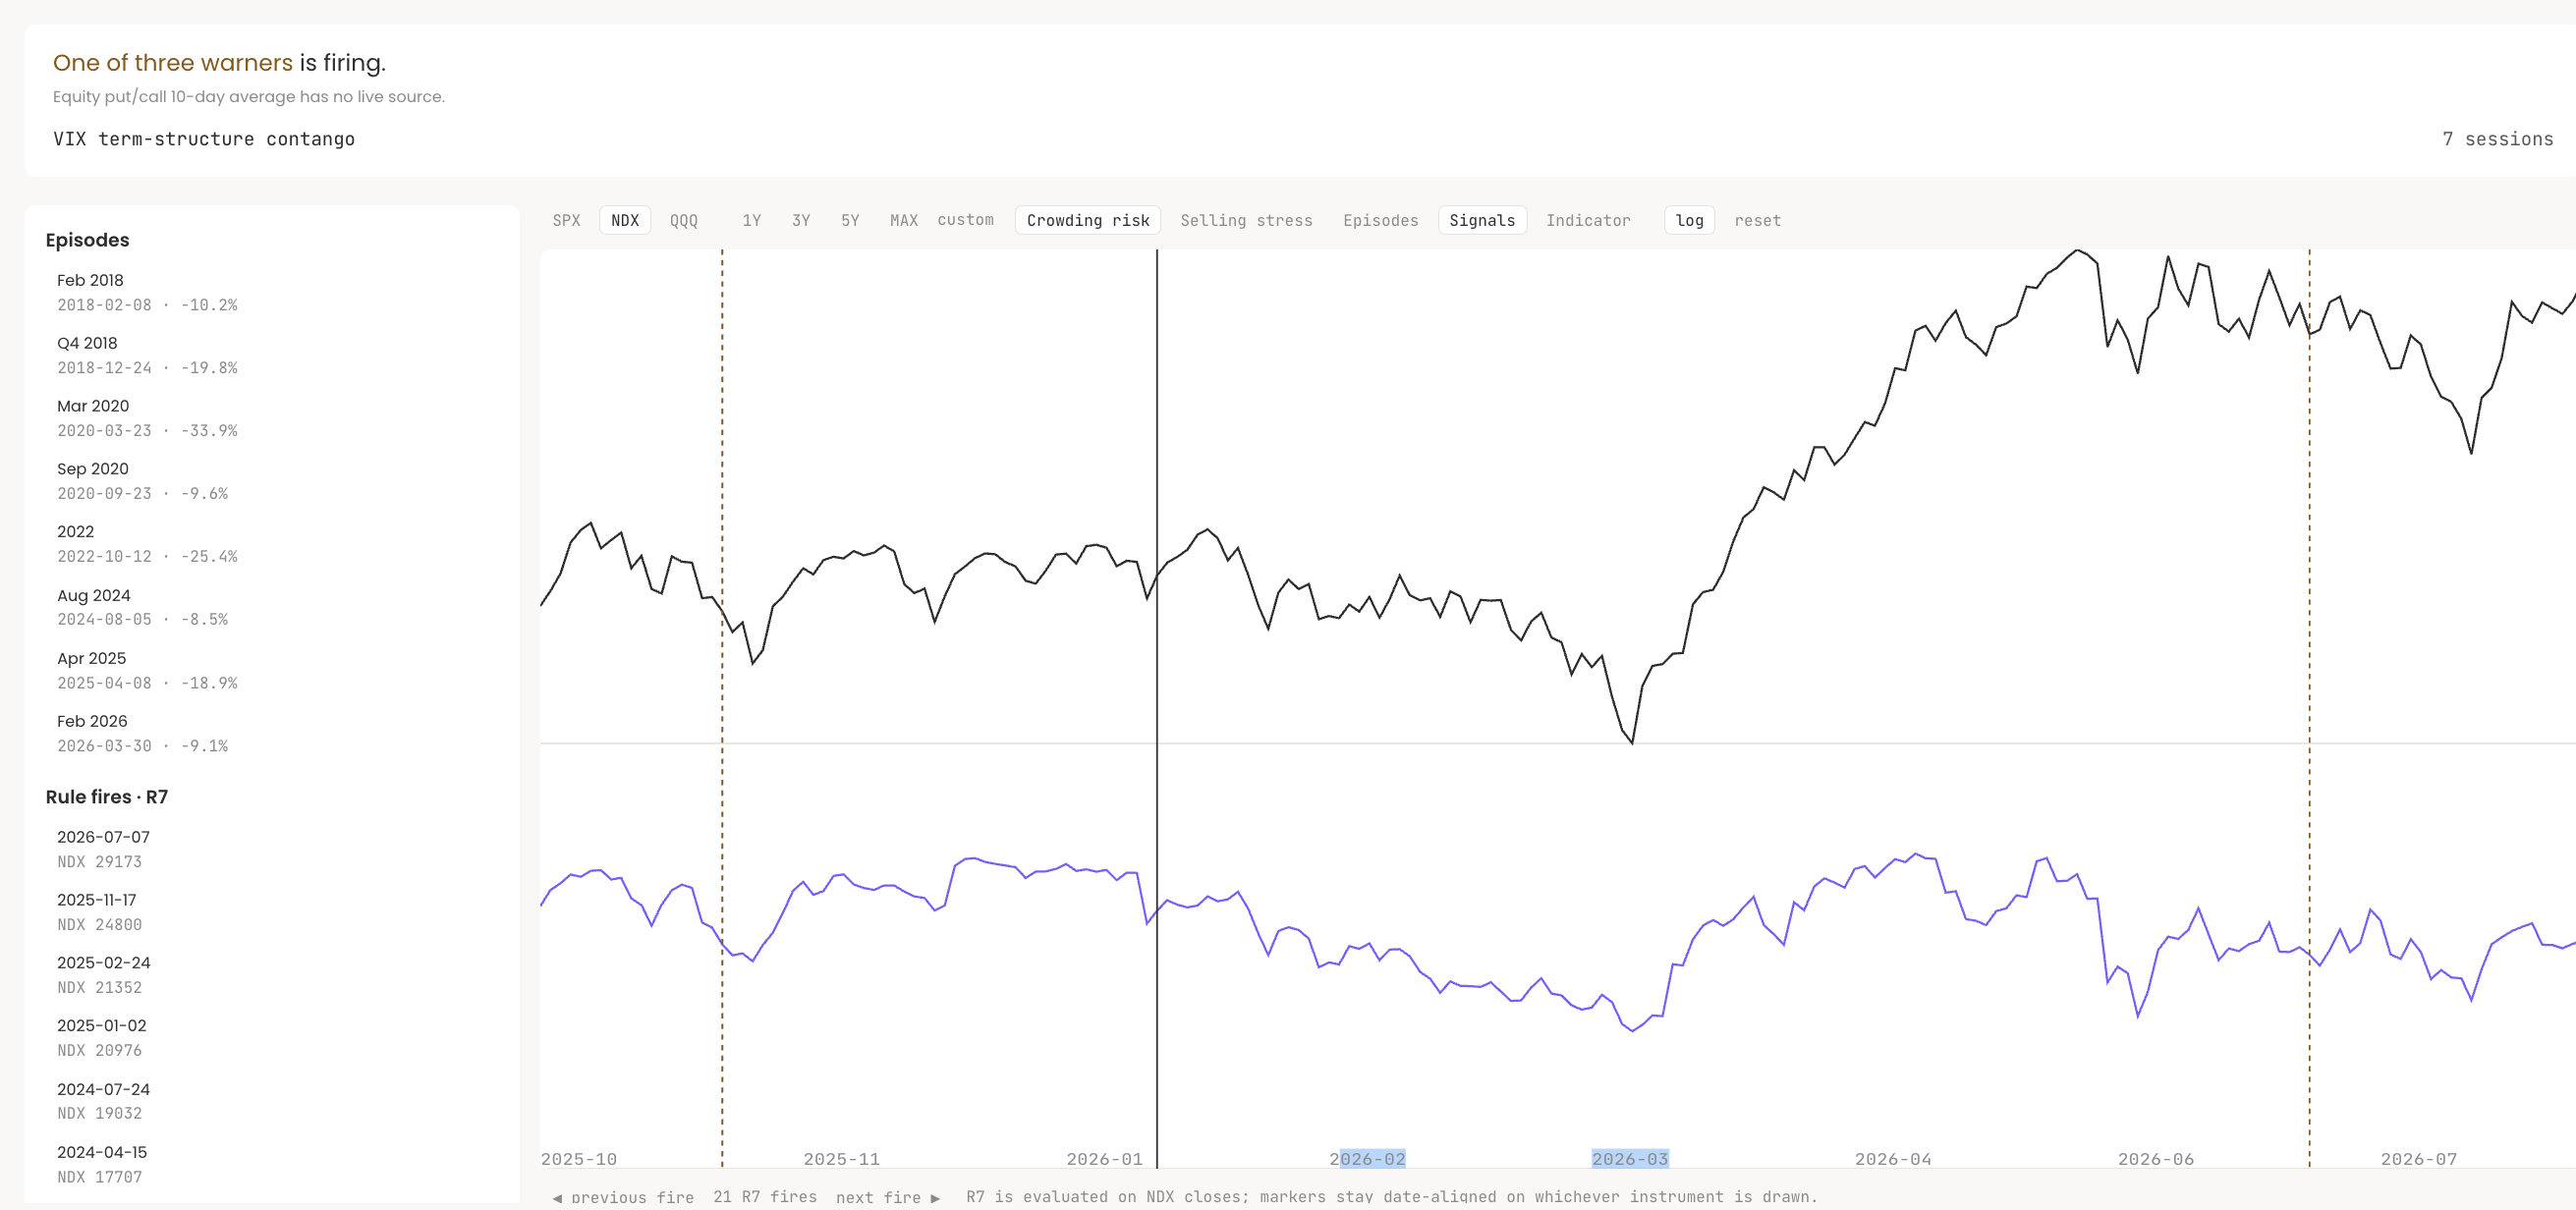
/flows and charts, paid for in losses
Decision · Zero weight until falsified
- Decision
- New indicators start at zero weight and cannot alter the headline score until they pass a precommitted historical test.
- Rejected
- Shipping plausible indicators on inspection. Both crowding candidates performed worse than the randomised comparison thresholds, so they received no score contribution and no user-facing alert.
- Result
- A replay across 263 stocks and 1,255 sessions tested seven theme baskets. None passed the calm-market falsification test, so all remained observation-only.
I profited when Trump reversed course on Iran, then suffered heavy losses during the Korean deleveraging. That exposed a gap neither monitoring nor company research covered: a sound thesis can still lose money when positioning becomes crowded and forced selling begins.
- /flows separates crowding, one-sided leveraged positioning, from washout, forced selling already visible in prices. It measures fragility; it gives no timing, allocation or return call. The same lens as the supply chains: liquidity as the commodity, leverage as capacity and crowded positioning as concentrated inventory.
- The chart layer answers “what is price structure doing?” before it can recommend action. One anomaly run emits at most one critical Slack event, so five related cascade anomalies do not produce five pages. Delivery fails open, so a Slack outage cannot stop detection.